TAC: TTP Artifact Correlation
by bri5ee and je55h
Background
The absence of a well-structured knowledge base significantly hinders effective incident response.
Imagine you’re an associate security analyst and it’s 3 AM. You are sound asleep when you hear Slack/Teams notifications go off in rapid succession from your phone. Checking your notifications, you see 15 CrowdStrike alerts for lateral movement activity. You get on your laptop and open up the Falcon dashboard to investigate. In the haste, you completely blank on where to start. You begin trying to look back at previous incident notes in Confluence, but with no standardized format, you struggle to identify anything that is of use.
As panic sets in, even fundamental artifacts linked to lateral movement TTPs elude your memory. Minutes slip away without any meaningful progress. You find yourself yearning for a centralized repository where you can readily correlate TTPs with the associated artifacts.
Traditional documentation practices—or lack thereof—result in ad hoc comments being the only traces left after an incident. Lacking consistent organization, they are unintuitive and difficult to reference, demonstrating the challenge of maintaining constructive documentation. The following points further depict our observations.
- The majority of documentation is generated during incident response, making it a secondary priority.
- Poor documentation often leads to more frustrations, discouraging its usage.
- The lack of an intuitive centralized documentation structure leads to many preferring to take individual notes over a team-wide knowledge base.
The goal of TAC is to eliminate all these pain points by directly tackling the lack of an intuitive and universally digestible format for notes.
Logic
TAC, or TTP Artifact Correlation, is a method of dynamically documenting and ingesting incident response artifacts. TAC leverages the “backlinks” feature native to Obsidian to correlate pieces of information across various sections it is referenced in. Although conceptualized in Obsidian, this method could be adapted and applied in other note-taking applications.
Under TAC, incident response notes will be categorized into three subcategories–Description, Activity, and Artifacts. The description will provide a general overview of the technique / procedure being performed, activity encompasses what responders sort of activity should be emitted from successful execution of a technique / procedure, and lastly artifacts that are created from the technique / procedure which can encompass log sources from EDRs, AV, etc.
The ultimate goal behind the logic of TAC is to take these three subcategories and establish links between the scenarios they appear in. This allows responders to be able to quickly identify associations between these three subcategories which should yield faster rates in which responders can detect, contain, eradicate, and recover from an incident. TAC also promotes the creation of a knowledgebase of post-incident activity to ensure if future incidents occur in a similar manner, all relevant information is straightforward and accessible.
Markdown
Before we dive into Obsidian and how it plays an integral part on how TAC functions, we must talk about markdown. Markdown is a “lightweight markup language that you can use to add formatting elements to plaintext text documents”. You have most likely seen or used Markdown from README.md files on places like GitHub, Notion, etc. At its core, Markdown allows for a wider capability in note taking by allowing for headers, links, code blocks, etc. which allows a note taker to better present documentation and notes to teammates and general readers. A resource I would suggest readers take a look into if it is their first time diving into Markdown is this.
Obsidian
With the discussion of Markdown out of the way, let’s talk about Obsidian. Obsidian is just like any traditional editor as it operates on Markdown files, except it has an overarching primary use case: a knowledge base. You might be thinking, “Well of course it is a knowledge base! A conglomeration of notes is a knowledge base!” And you might be right, except we’d argue that this is more of a cluster of notes. Typically, categorizing notes is done through naming conventions and folder structures. For example, maybe you have a college class and you call it CS101 for your computer science class. Within it are folders for each week and within those folders are notes for that week. This sort of folder categorization is great, but an issue arises when the actual contents of your notes need to correlate to one another. For example, let’s say something mentioned the first week of your CS class that was pivotal to a concept 6 weeks later. What would be the best way to correlate that specific concept from week 1 and link it to week 7? Mention to look back and forth between notes and correlate it that way? Maybe copy paste the exact contents of one note into the other? Obsidian addresses this issue using its clever backlinks feature.
Obsidian introduces the ability to create links within notes which allows users to be able to visualize these connections as a graph. These clickable links allow users to jump from their currents section directly to a referenced section within another note. This eliminates the hassle of having to search through notes for the referenced information while also preventing redundancy between notes.
Linking
By simply wrapping text around double brackets ([[ ]]), the ability to link ideas and topics comes to life.
If you have not seen what Obsidian’s linking capabilities look like, let’s take a look at a Reddit user’s graph view of their links:
 Graph Showcase Of Reddit User’s First 3 Months in Obsidian
This is a graphical view of every single link this user has made and how they might correlate to each other. A link could go to one note, multiple notes, multiple sections, etc. It could also be created as a blank link to be filled in the future. You are probably wondering how this graph could be of any use because it simply looks like eye-candy, and that’s a fair point. However, this feature takes shape when the relationship between notes follow a logical structure, allowing the user to visualize and quickly pinpoint the information they are looking to find. Regardless, this feature does not represent the main purpose of TAC–providing cohesive structure to how techniques and procedures can be correlated to artifacts is the main objective.
Let’s take a look at a common workflow analysts and incident responders would encounter when they receive a security alert. When alerts are fired off in an enterprise, they typically come in through a pipeline that ultimately shows an alert through email, Slack, Teams, etc.
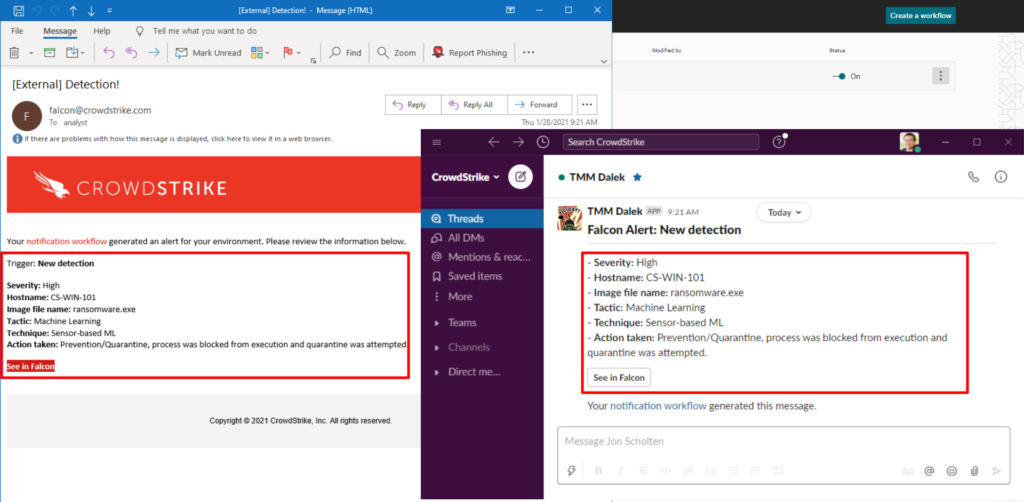 CrowdStrike Notification Workflows
In the example above, CrowdStrike alerts are being sent through email and through a Slack app. After seeing the alert, responders will be presented with a dashboard similar to the following:
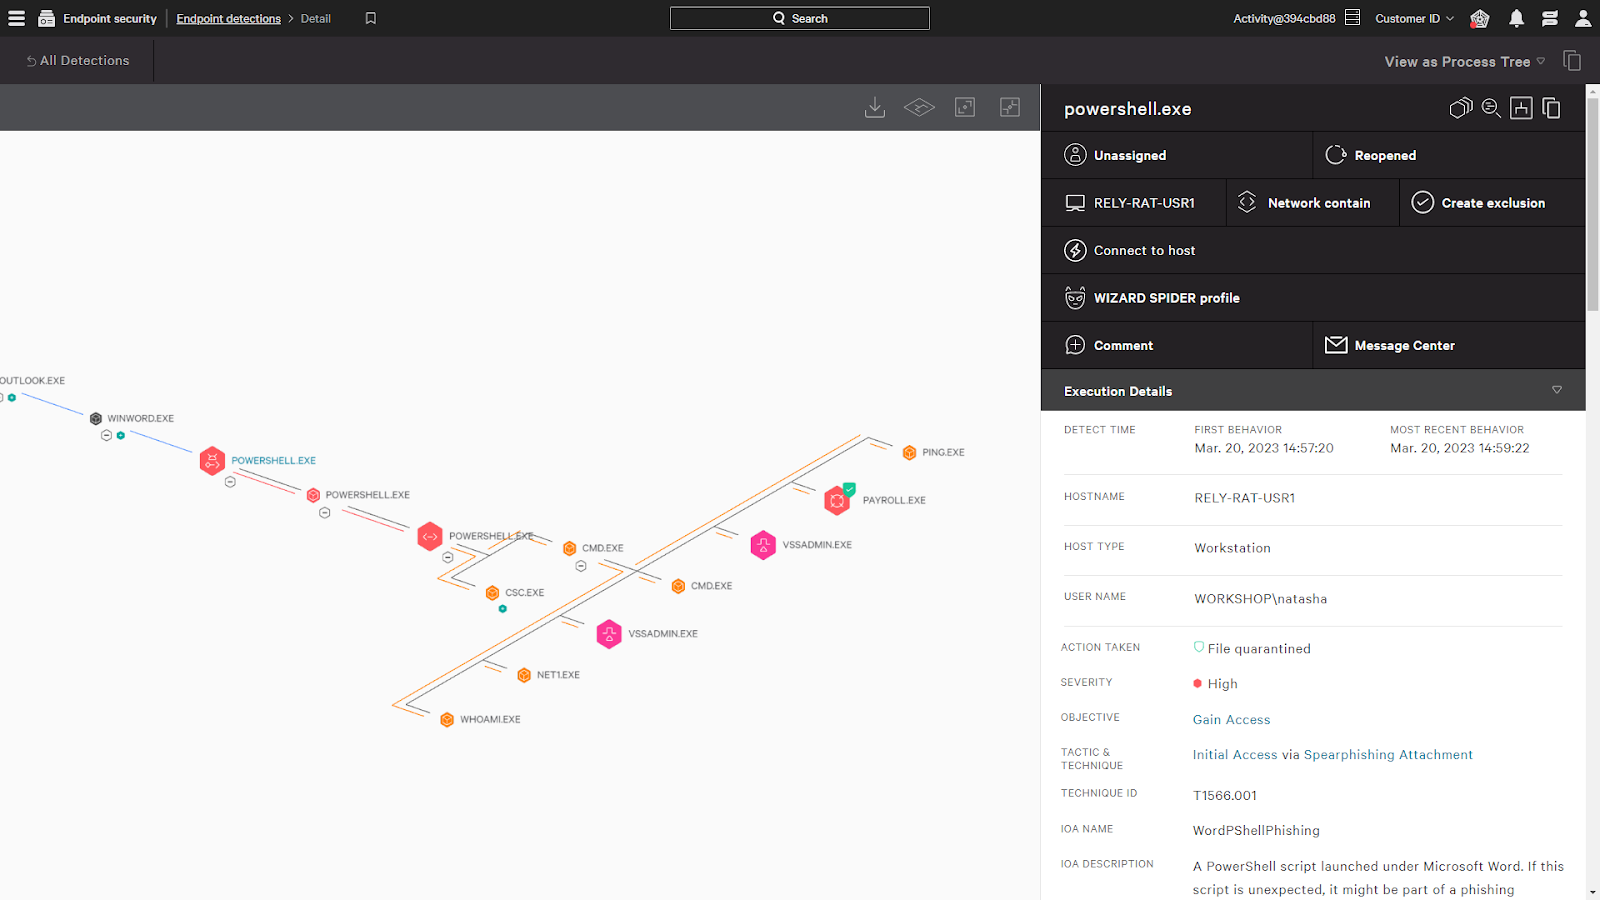
The issue that rises now is where do you look? Why is the process tree the way it is? Is this activity normal? CrowdStrike and other products that alert you on anomalous / malicious activity only provide so much detail and it is up to the responders to identify anomalies and make connections. This is where TAC shines–in bridging the initial identification of an alert to gaining a better understanding of the situation at hand using existing knowledge.
Organization
Before we begin implementing TAC, I’d highly suggest you have some sort of organization implemented into this workflow. One that we’ve adopted is similar to TrustedSec’s note taking style, except it is incident response related. TrustedSec’s note taking style utilizes a global index, primary categories, secondary categories, and a content folder.
- Global Index - A page that presents all of the primary categories you can navigate to. The global index almost acts as a landing page for responders to go to first.
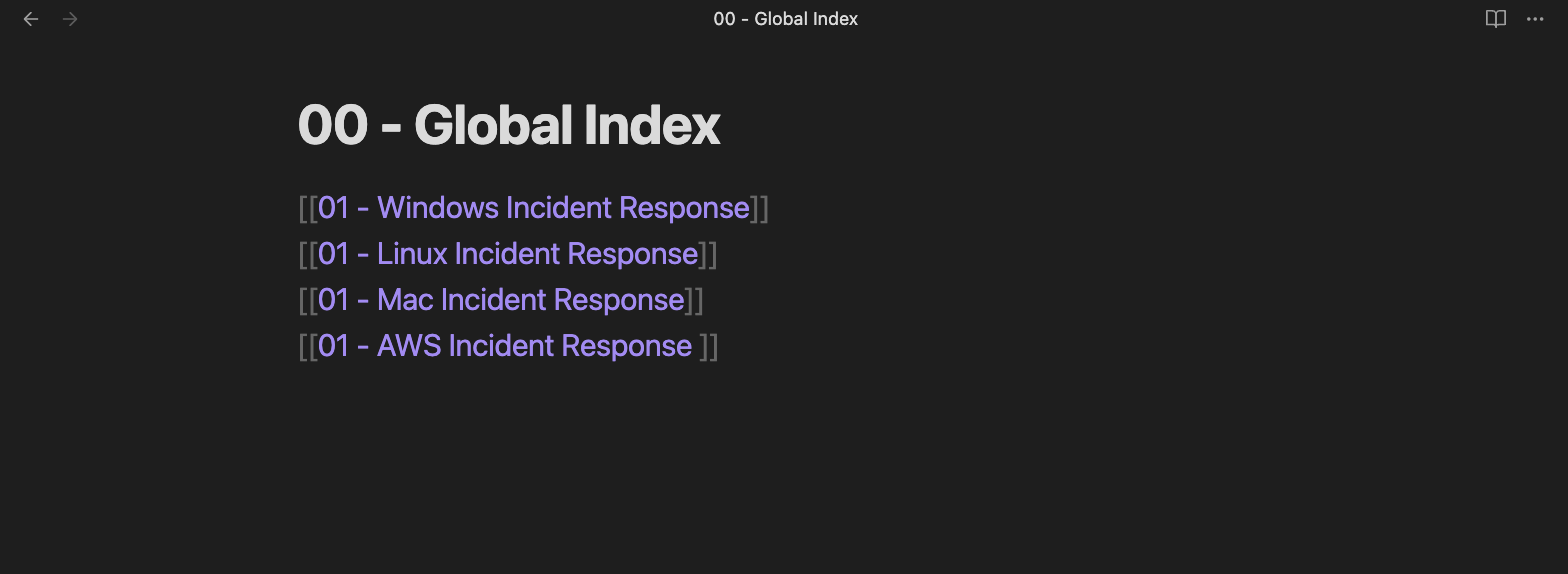
- Primary Categories - Note that within the global index, each link is appended with 01 -. The 01 signifies that the link is going to be a primary category. A primary category will contains a list of secondary categories that are related to the primary category. Let’s look at the primary category “01 - Windows Incident Response”. Something to assume is that if this is the overlying primary topic, secondary topics would be related to things you would look for during incident response procedures.
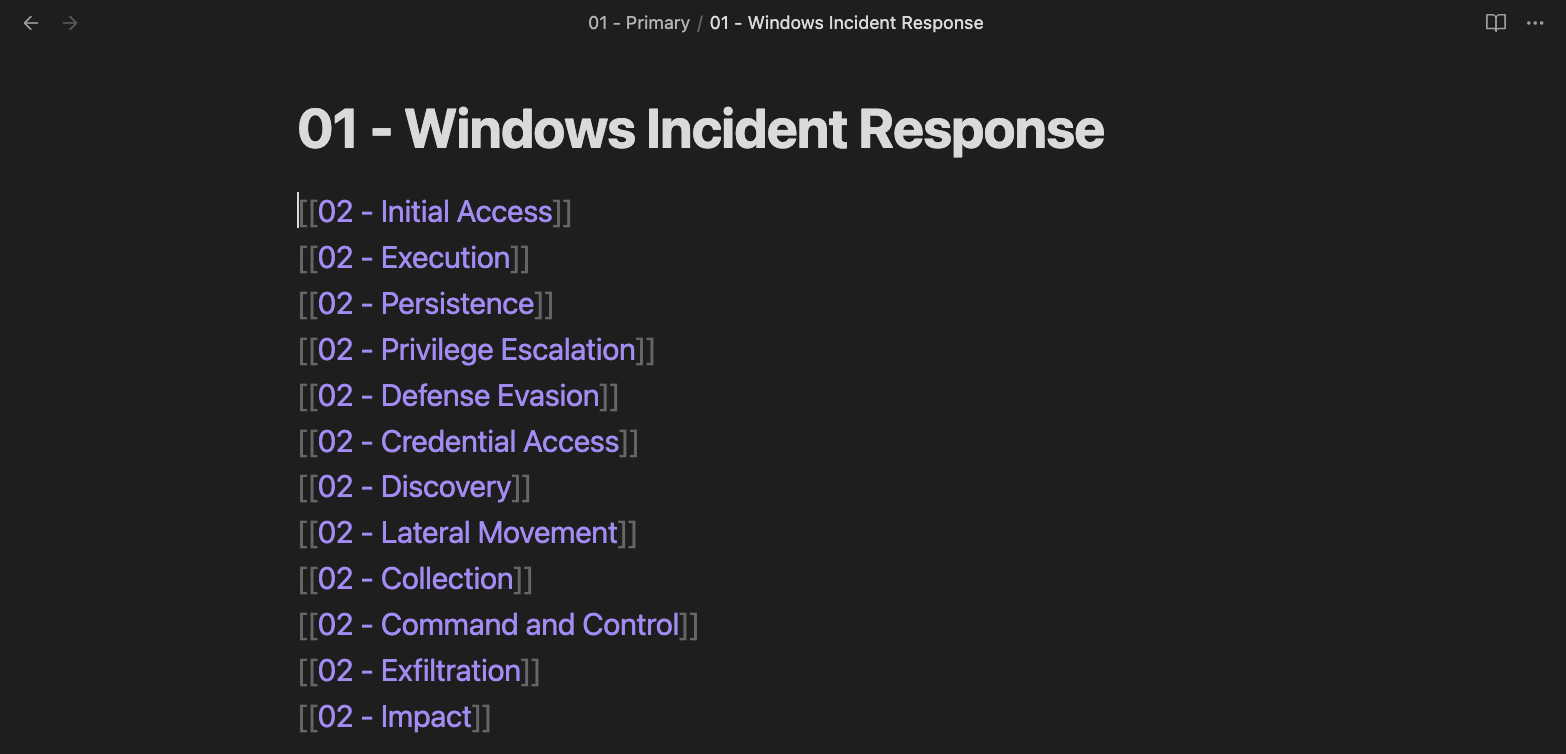
- Secondary Categories - These categories will link specifically to the content for its topic. For example, if we click on 02 - Lateral Movement, we should expect to see Windows lateral movement techniques such as
PsExec,WMI, etc. We only put two here just for simplicity but this will grow as you document more lateral movement techniques.

- Content - This is where TAC comes into play. The content itself will be represented of techniques and procedures, but will be correlated with artifacts to help responders sift through events that are related to their specific alert, in this case
PsExec.
TAC Workflow Example 1
To give you an idea of how TAC can incorporate into your incident response procedures, let’s take a look at an example. Let’s assume that you just got a CrowdStrike alert for lateral movement activity happening within your domain. Within your EDR dashboard you see the following process tree:
System
└── services.exe
    └── svchost.exe
        └── psexec.exe
            └── powershell.exe
                └── beacon_x64.exe
Within the process tree you’re given some things such as a description of the IOA (Incident of Attack), IOA Name, the Tactic & Technique, etc. But now in this case you need to identify what is happening and why it happened. Let’s say in this scenario this was given to a first time analyst to test their ability to go from initial triage of an alert to full remediation. Would they be able to do this given only the context from an EDR’s dashboard? Let’s see how TAC can help with transparency of this.
Content
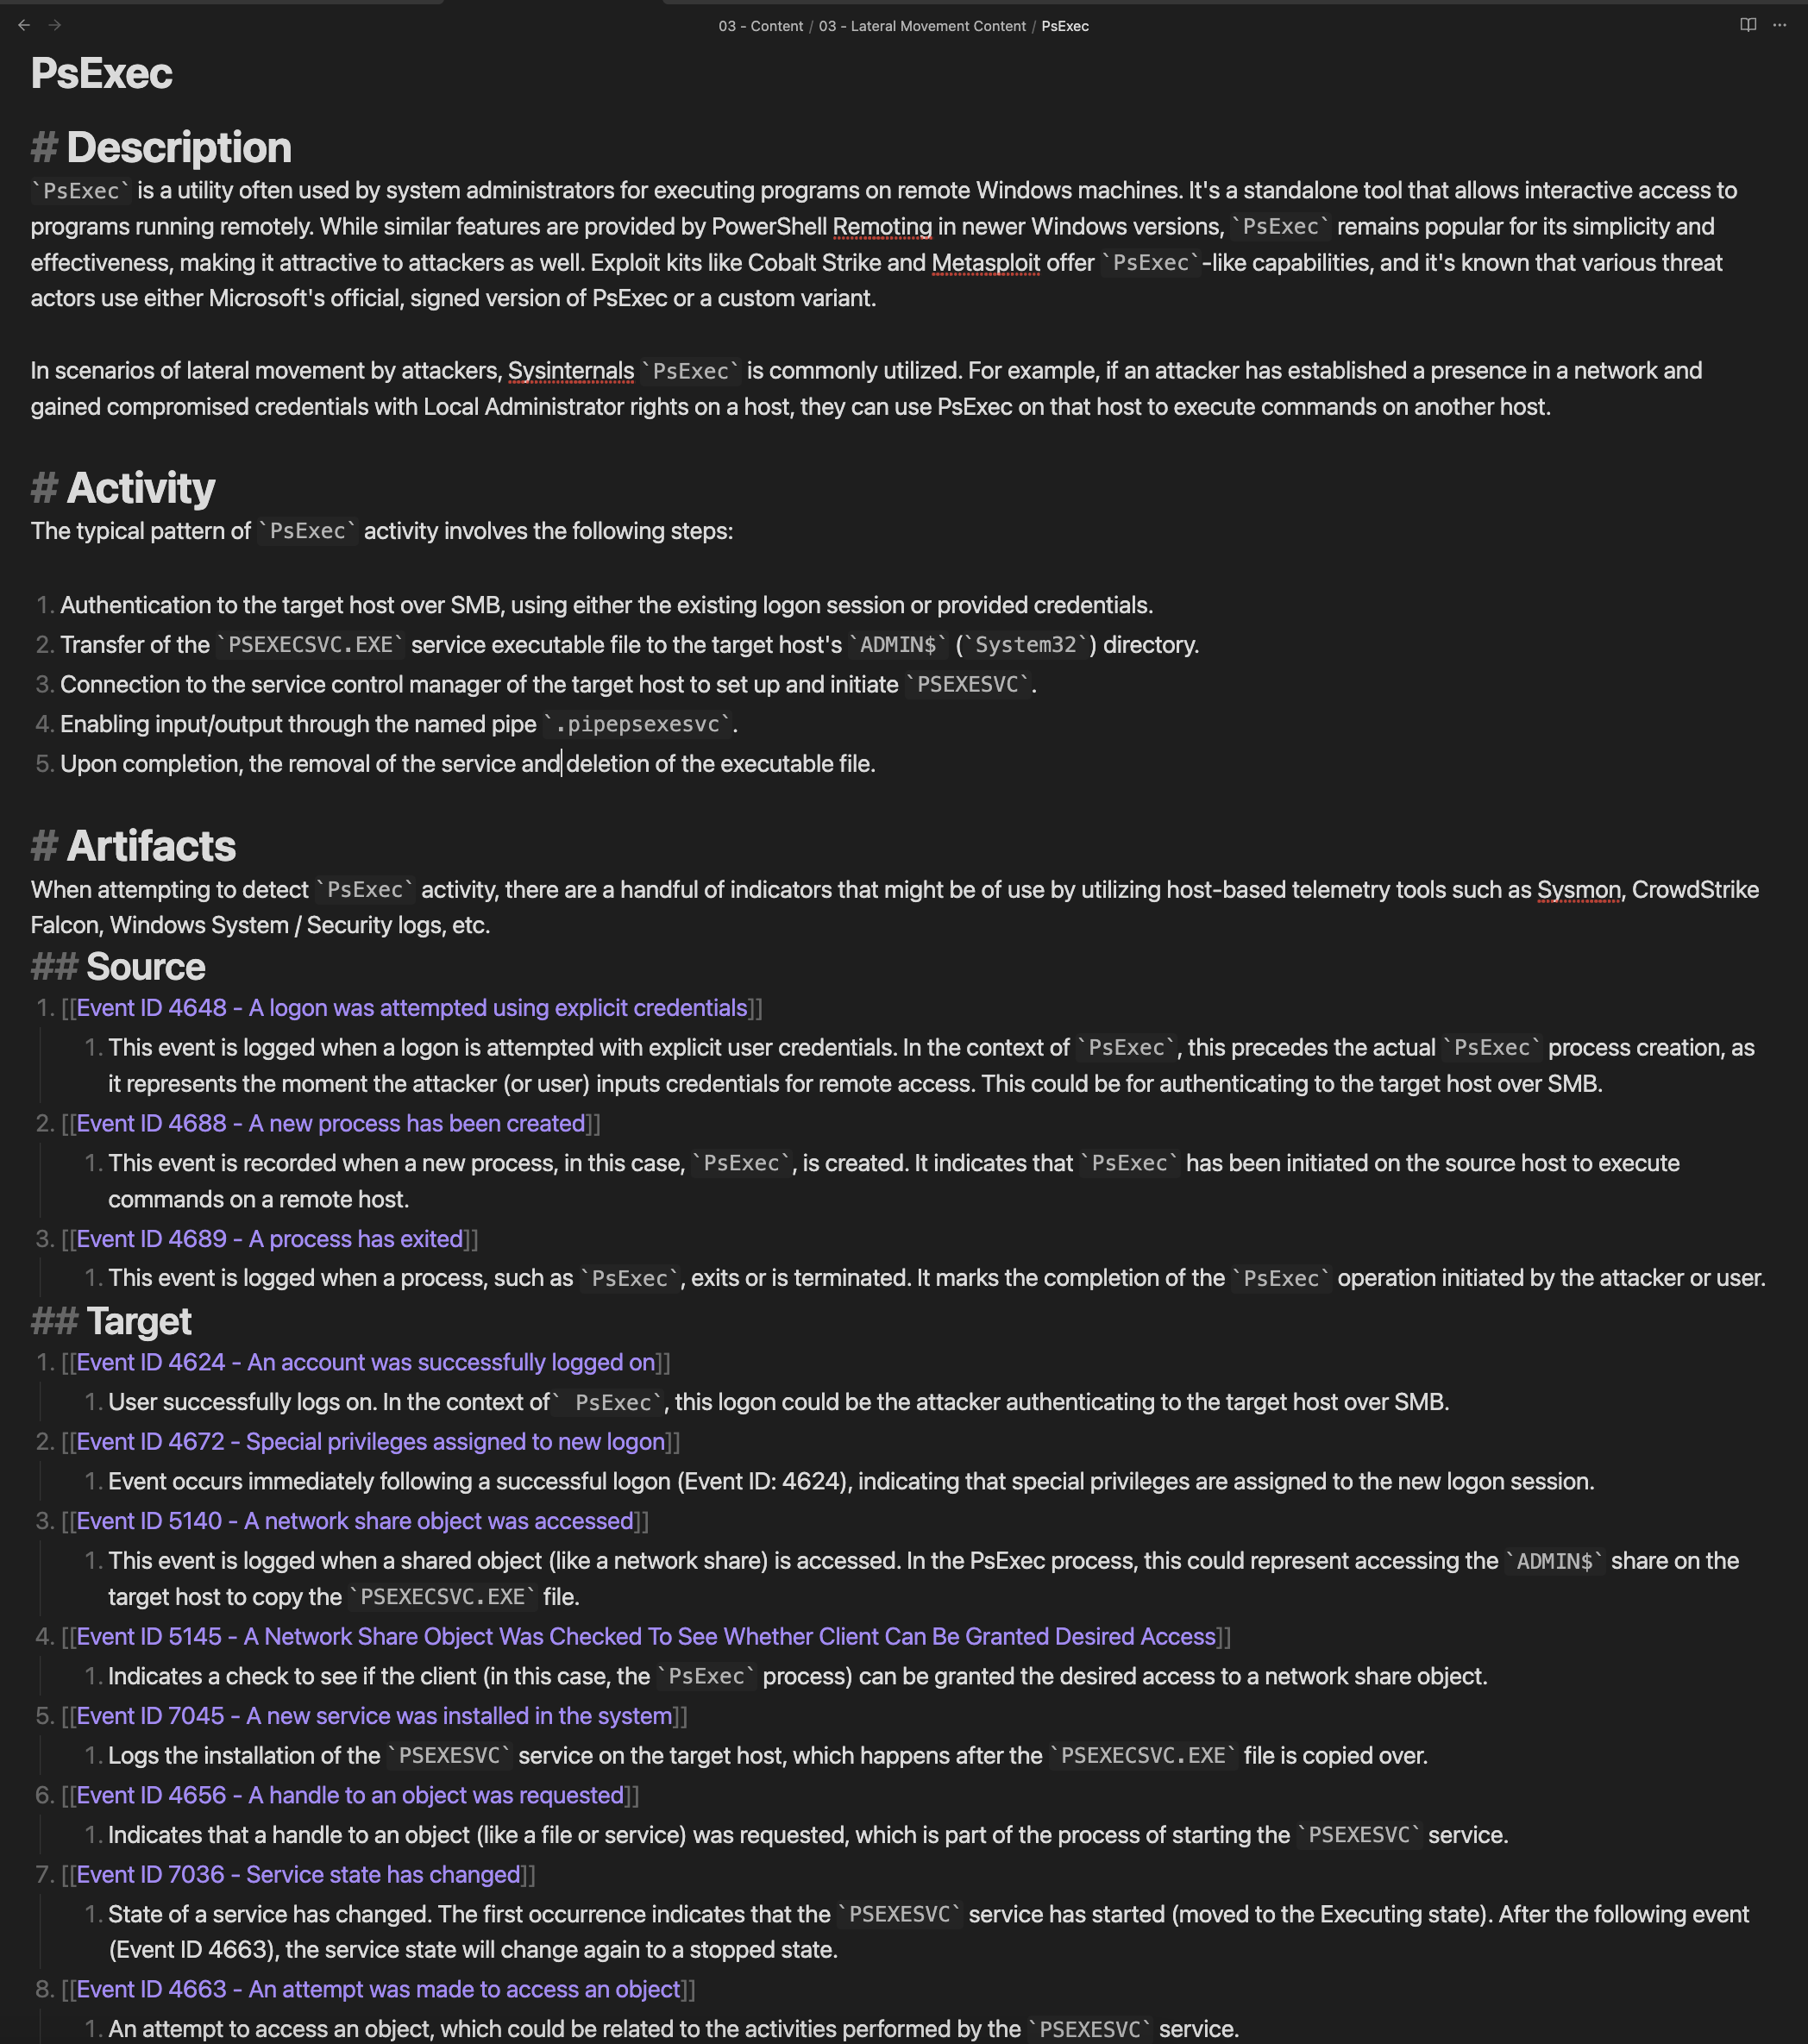
At its core, the content of each technique and procedure is what will differentiate an implementation of TAC from being good to excellent. Enabling TAC to be beneficial to responders requires thorough understanding of a particular technique / procedure and good note taking abilities. Knowing this, TAC should be perceived under the preparation phase of an incident response plan. To help aid with understanding an example of TAC, we provided an example of it with PsExec. The main thing with TAC is to ensure correlation with artifacts that would appear from a certain technique / procedure. In the case of PsExec, the artifacts we are interested in are logs that are produced from successful execution of PsExec with the goal of lateral movement. We would highly suggest having a brief description, activity, and artifacts section within your notes, but the main thing we will be discussing is the artifacts portion as this is what enables TAC.
Description
The beginning of your note should contain a high level overview of what this technique / procedure is. It is good to mention its legitimate use case (if it has one), as well as how it may be abused by adversaries. In the example of PsExec, noting how this utility used by system administrators to execute programs on remote Windows hosts and its use case in providing lateral movement capabilities for adversaries gives readers quick insight on what this technique / procedure is and what they should be expecting reading further.
Activity
Each technique / procedure should also contain bullet points on what activity to expect out of it. This is crucial for analysts and responders when investigating an alert or active incident as it transitions nicely into specific artifacts to be looking out for and investigating further.
Artifacts
Artifacts are representative of log sources, events, etc. from AVs, EDRs, system logs, etc. that are created from the execution of a technique / procedure. With PsExec, there are logs we would expect from both the source as well as the target. These log sources do not have to only be about event logs for Windows, but can be event types from CrowdStrike, Sentinel, Sysmon, etc. We would highly suggest adapting your event types based on what you primarily use during investigations and implementing them within your own notes.
There have been many times where we would use log sources from a resource such as CrowdStrike and would be unsure of exactly what event types we should be looking into for a specific alert, or the fact that we might not know what every single field and its value means. For example, CrowdStrike has an event type for ASEPs (Auto-Start Extensibility Points) that might be of interest. These can be things like registry run keys on a Windows host. Within the event type for this specific ASEP would be fields for the certain type of registry value being a DWORD, BINARY, etc. but would be denoted as numbers. This would lead me to have to pull up CrowdStrike’s huge PDF of event types and have to find the exact event type and what specific numbers correlate to for registry values. Knowing this issue, each event type, event ID, etc. will have its own content file within it that is correlated to the technique / procedure documented to ensure responders do not need to research or look elsewhere to understand what artifacts might be correlated to an alert, nor need to pull up external documentation to understand what specific field values mean for a certain log source.
Artifact Overview with Links
Clicking on an artifact such as Event ID 4648 will lead responders to another note giving a detailed overview of this specific log event, the fields within it, and exactly how they are defined.
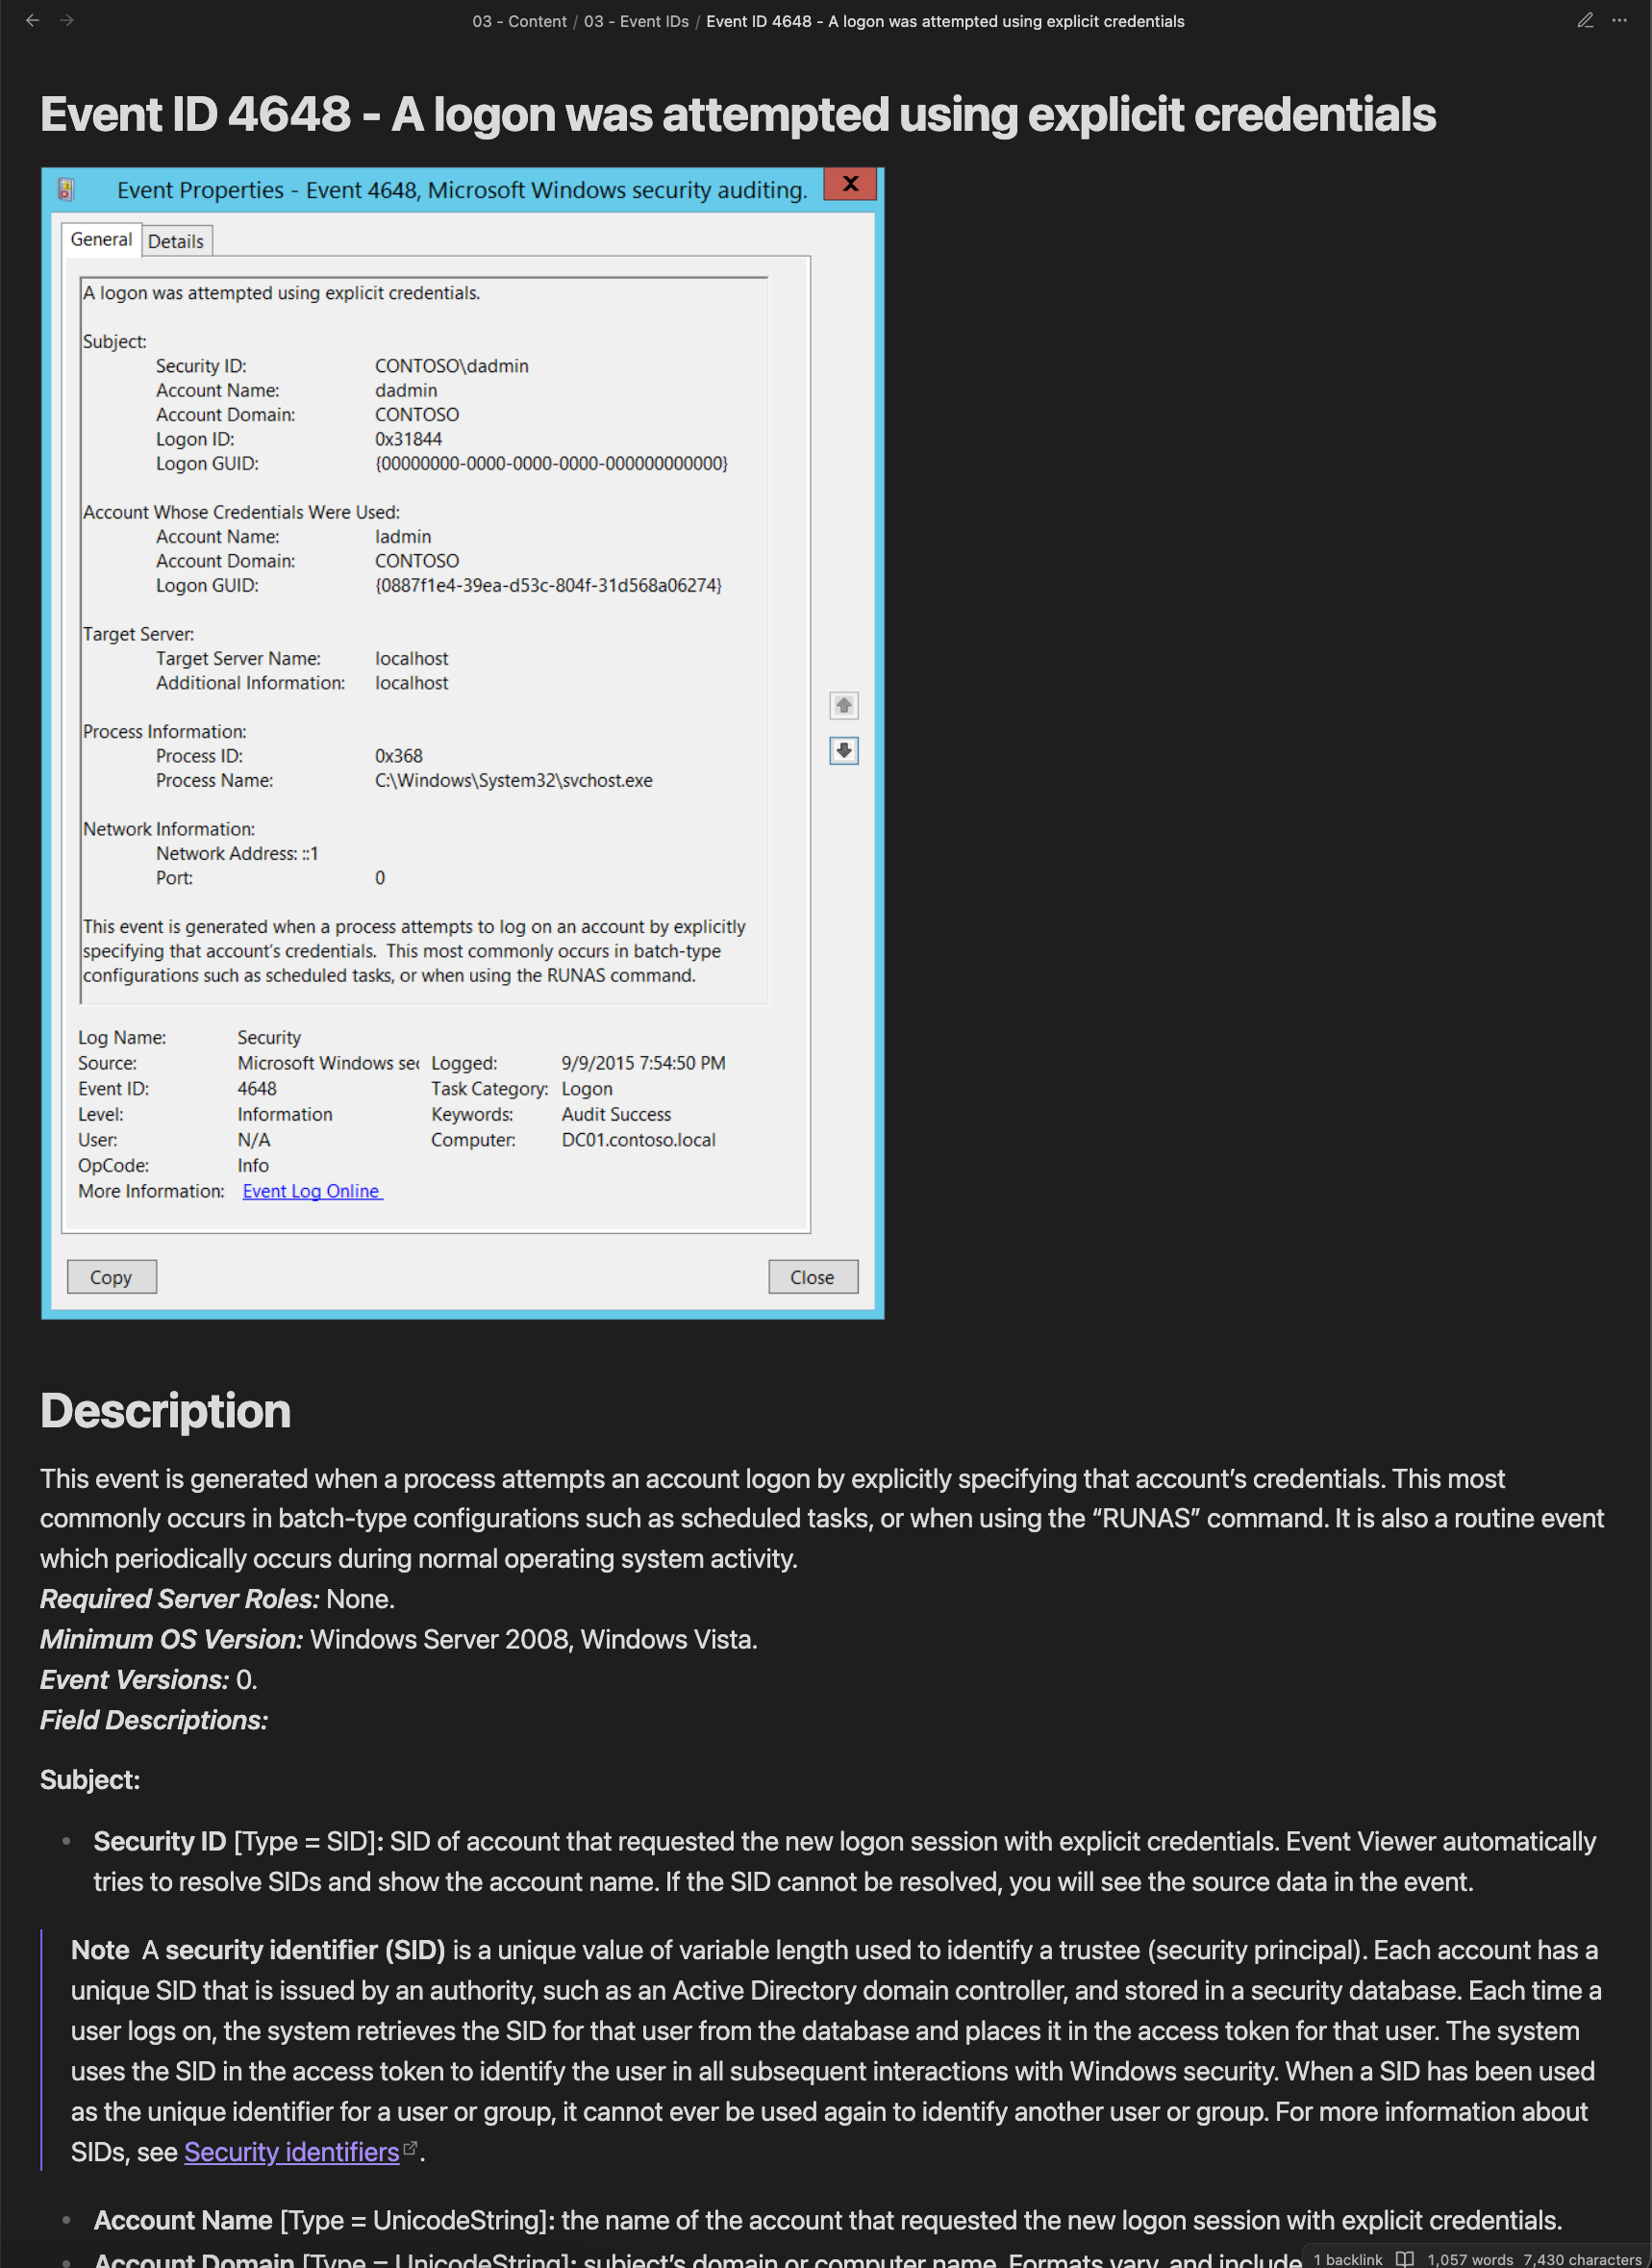
In this example it is just the exact documentation for event ID 4648 that is provided from Microsoft as an example, but should be custom tailored to your teams’ needs. The nice thing about TAC is that it aids in getting rid of redundancy. For example, if you use Sysmon and a certain technique / procedure creates a process, you can be sure you’ll see Event ID 1 a lot. Rather than having to mention what Event ID 1 is every single time you make a note, you can instead just use a link to the Sysmon Event ID 1 content note and only write a description on what exactly to look for for that specific technique / procedure and how Event ID 1 correlates to it.
A visual representation of TAC should look something like this:
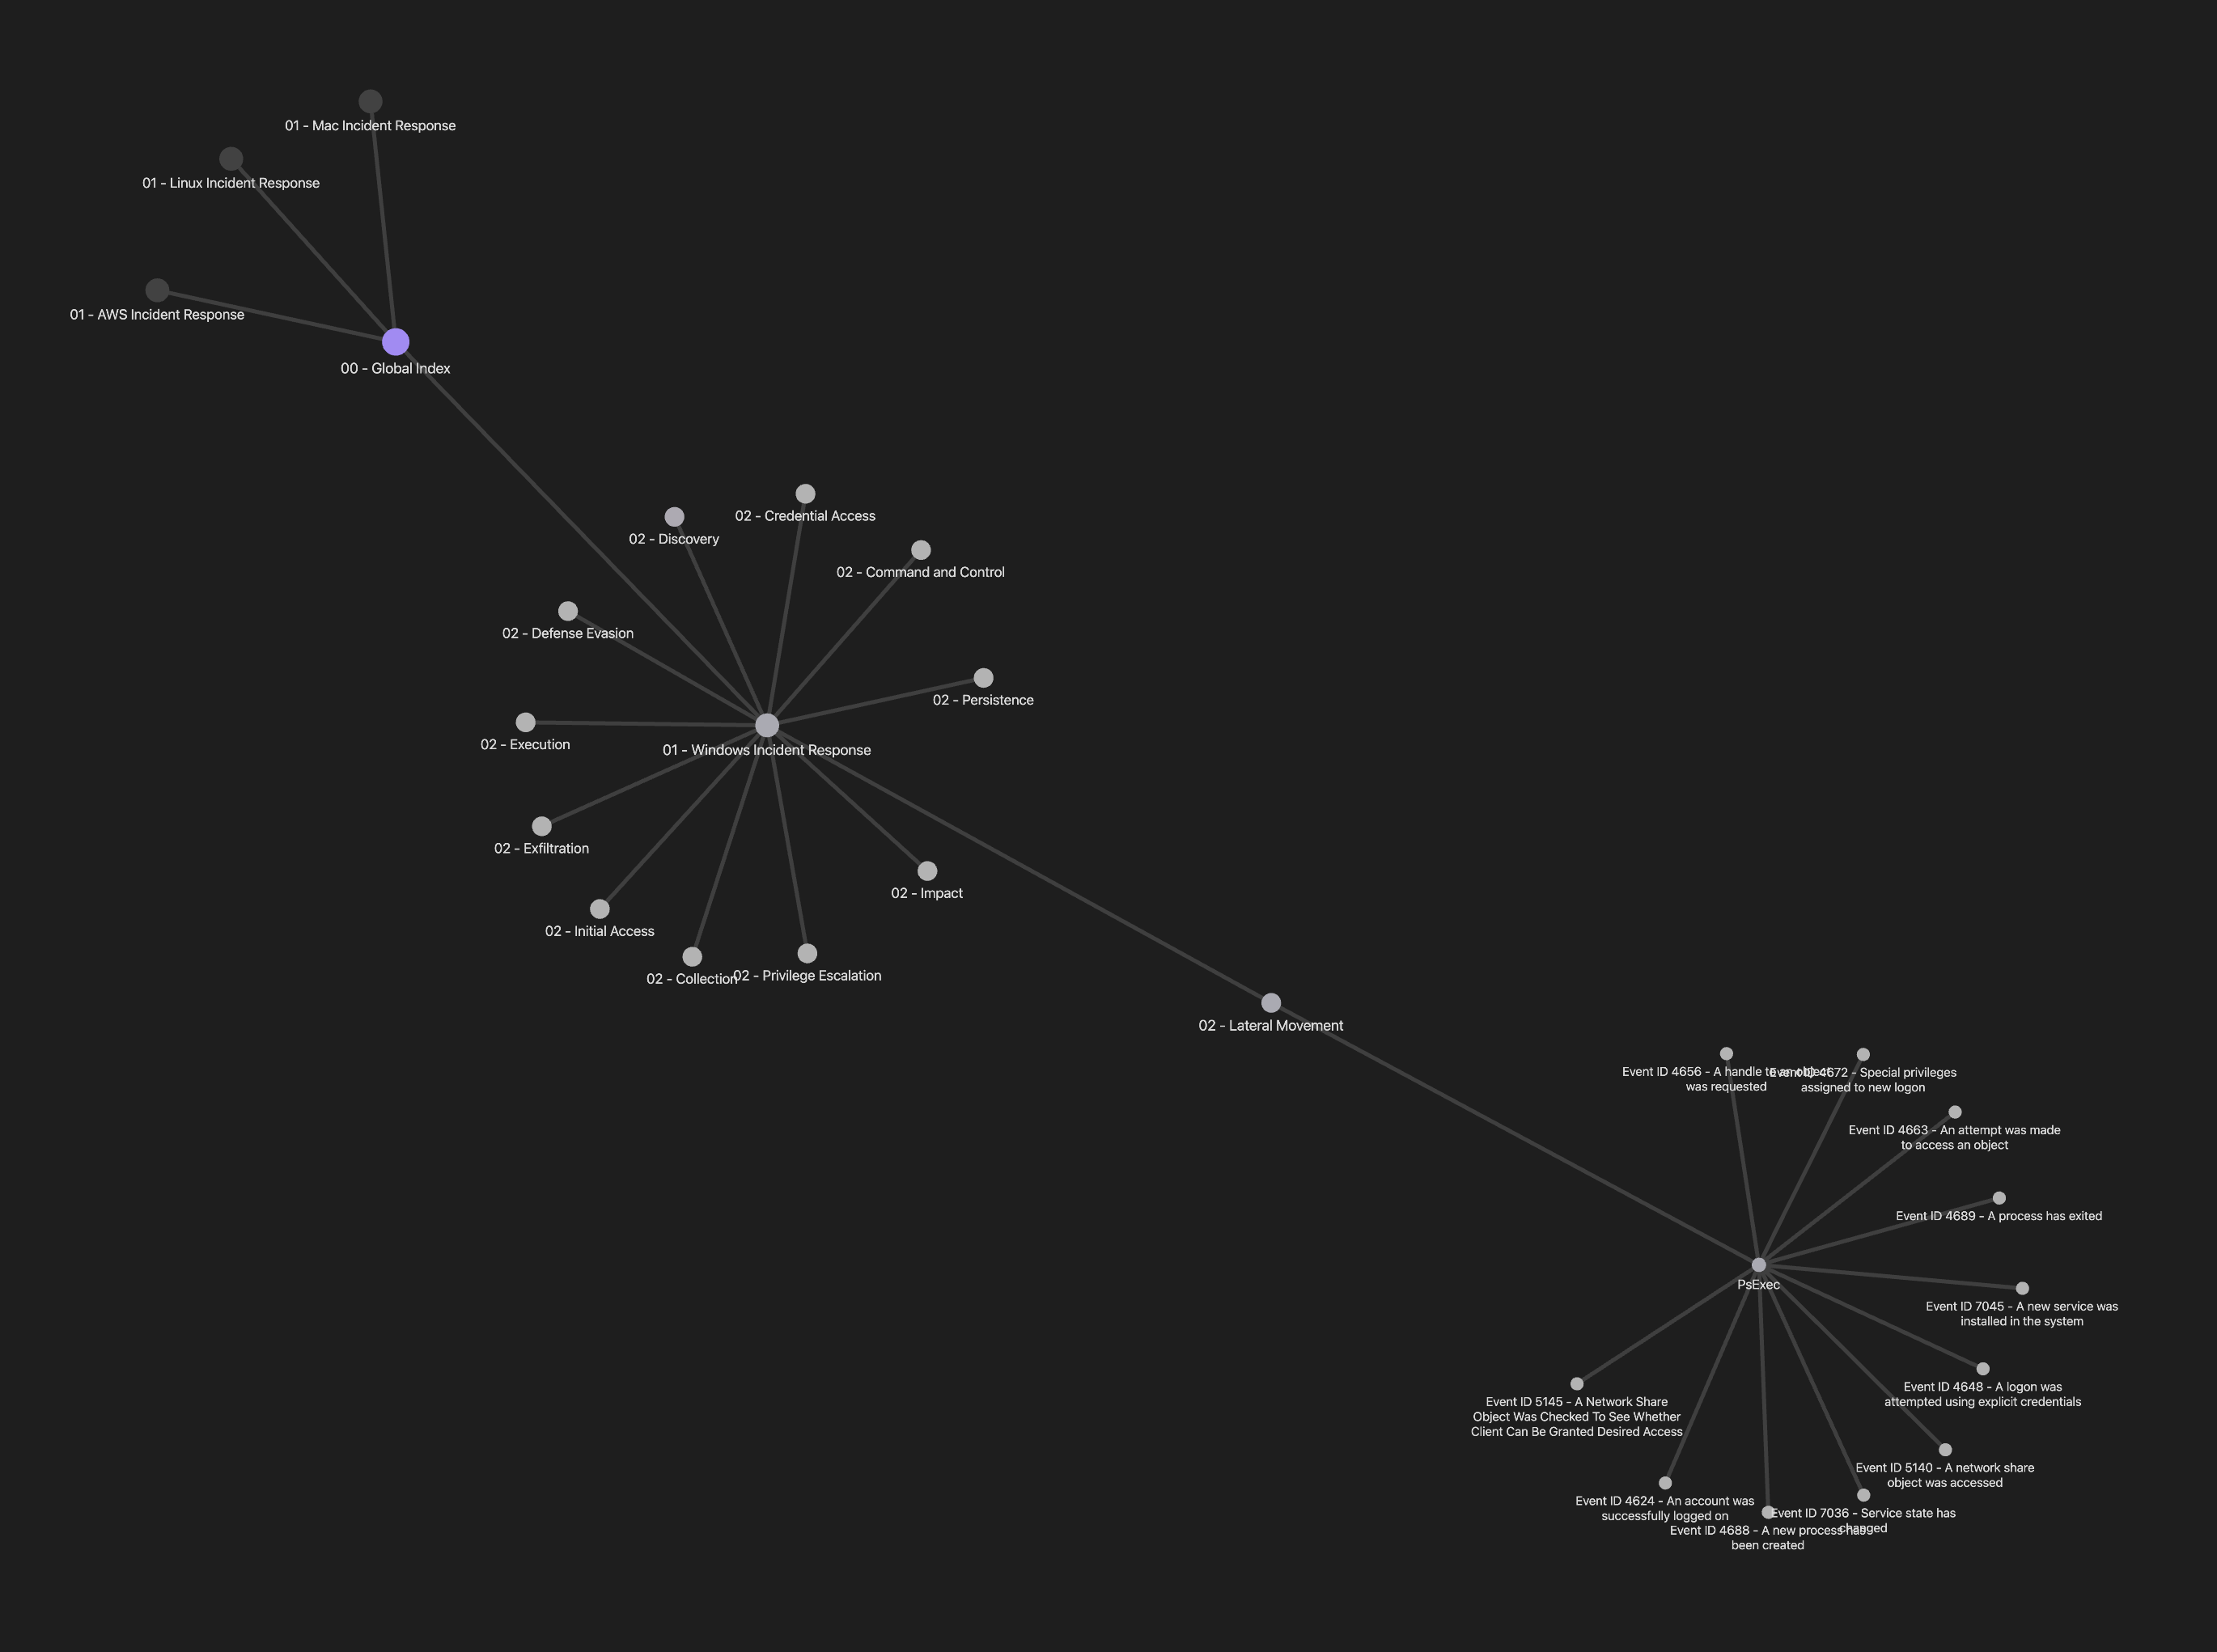
A responder should be able to see “Lateral Movement” as an alert, see that it is specific to PsExec, and be able to easily go into their SIEM, EDR tool, etc. and know what to start digging into in terms of artifacts. Given that notes for each technique / procedure and each log event are well written, there should be a huge sense of clarity when diving into an alert. Aside from the core idea of correlating artifacts to TTPs through links, the world is yours to go and expand the capabilities of TAC to your teams’ needs! Some ideas we have are having detection capabilities linked to TTPs, incidents linked to TTPs, playbooks linked to TTPs, etc. For example, you can have sections for detection logic created within Splunk, ELK, etc. how this technique / procedure is mapped within MITRE ATT&CK, a resource section for analysts / responders to look into, etc.
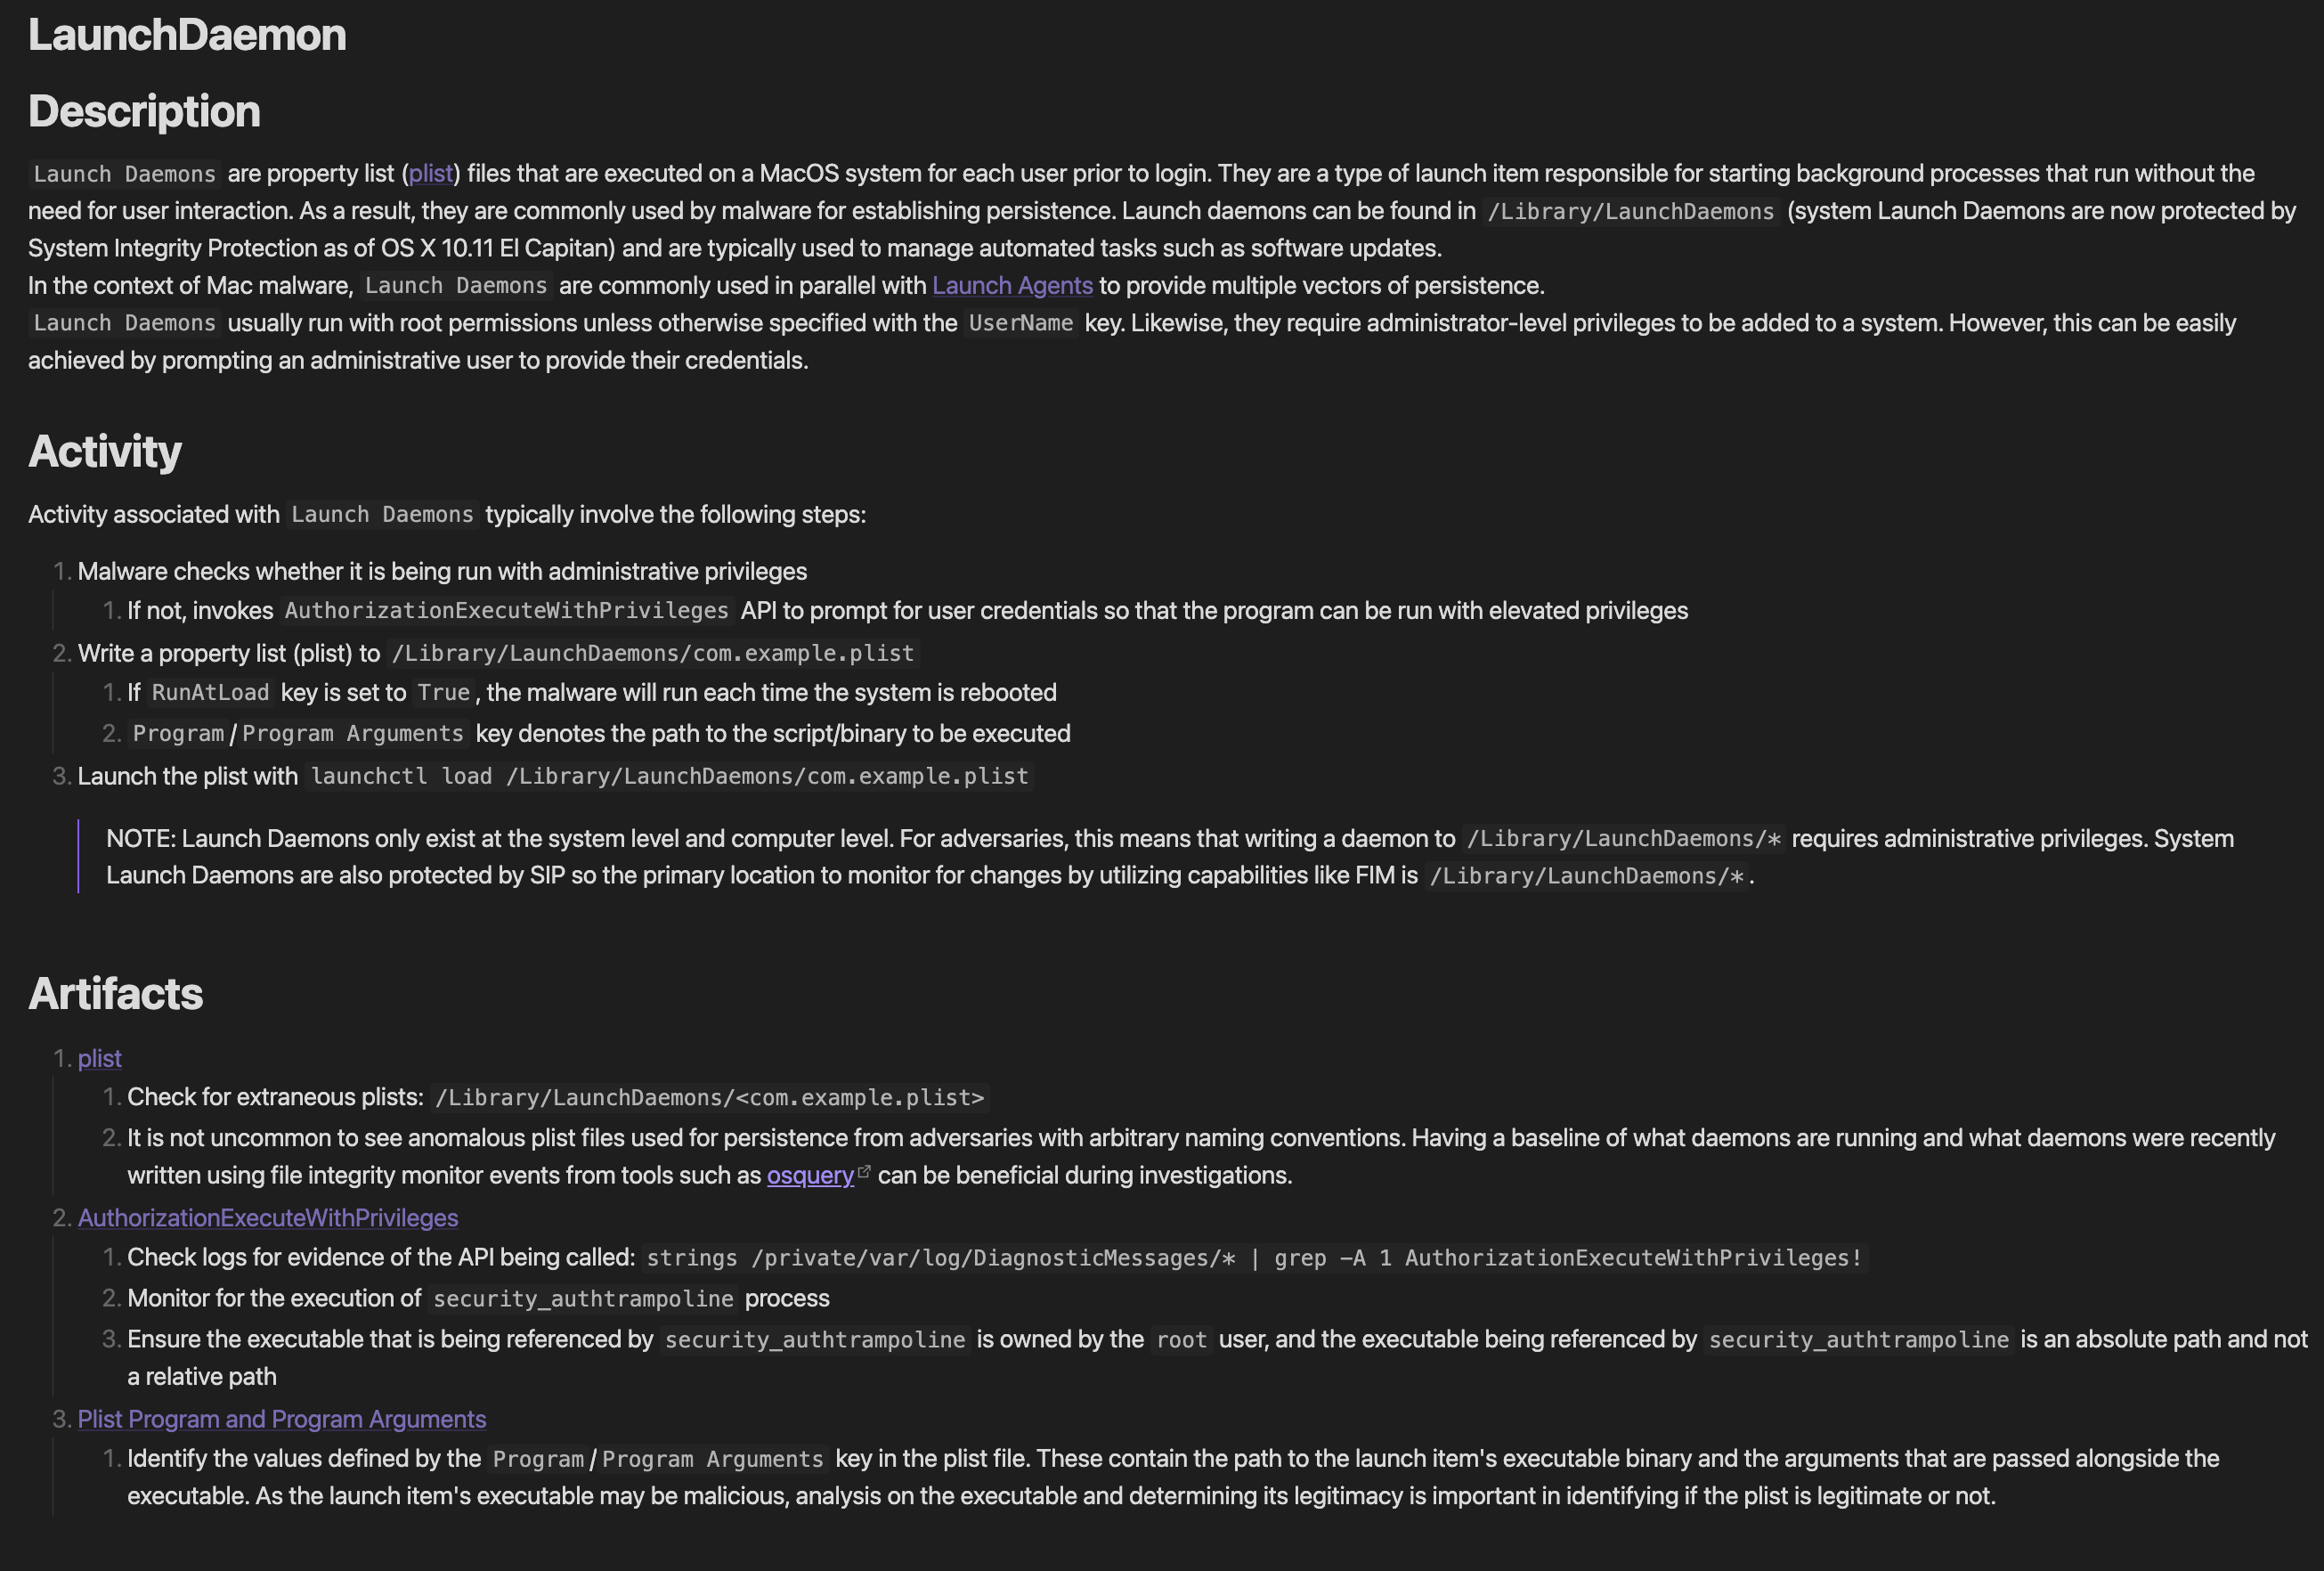
TAC Workflow Example 2
Let’s look at another example more tailored towards Mac: Launch Daemon Persistence. Note that although Mac detections are not particularly similar to how Windows events are portrayed by event IDs, artifacts can still be laid out and correlated using TAC. In this example, artifacts can be found in API executions and plist files compared to event IDs and will contain the same structure as the previous TAC workflow example:
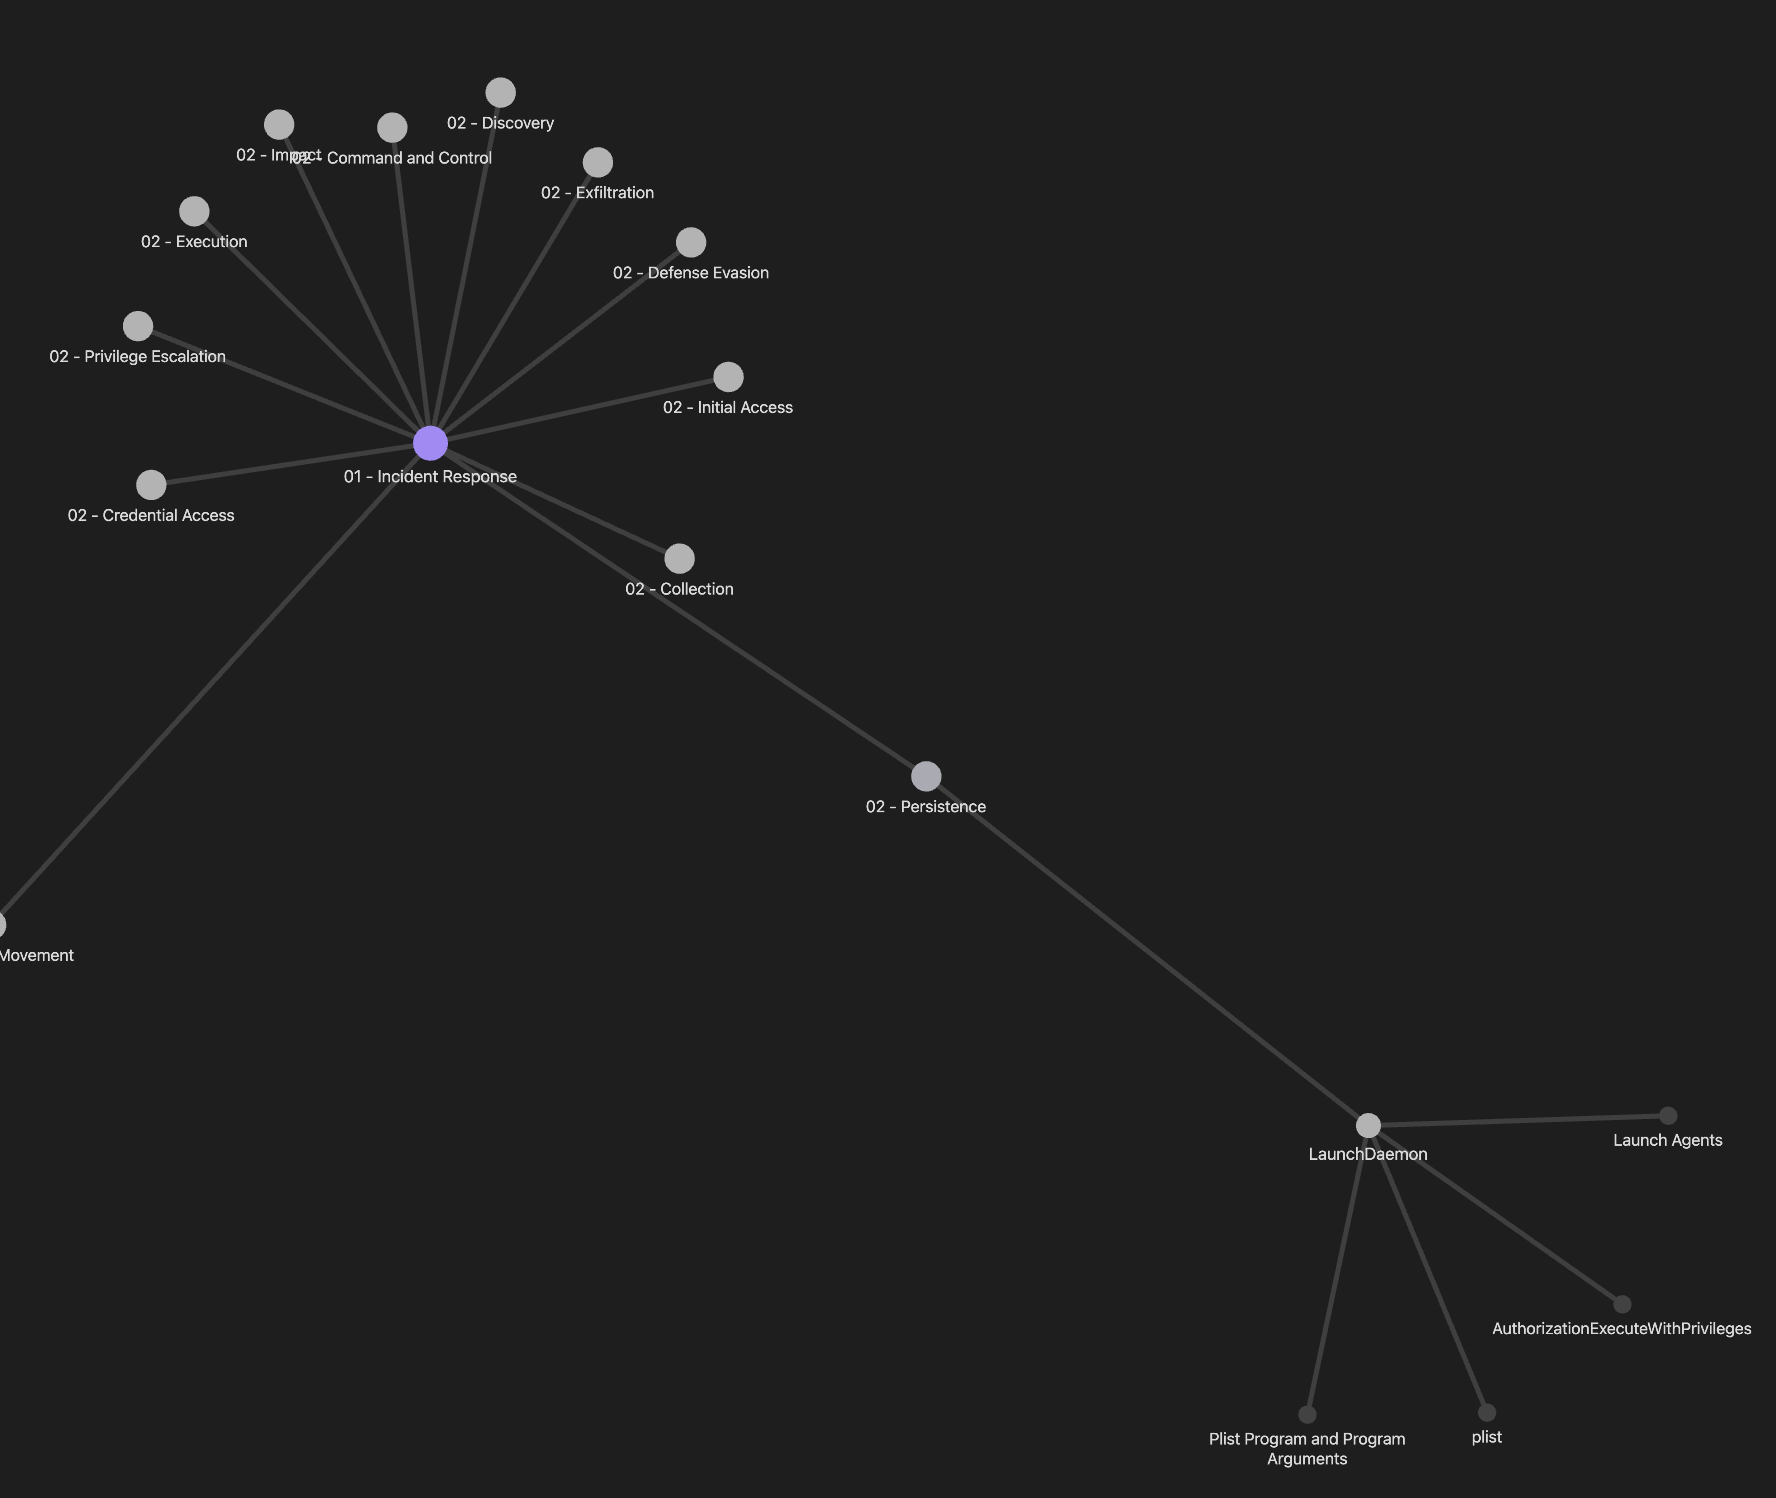
Similar to the lateral movement example with PsExec, each artifact will have a brief description of what to look for in accordance to the technique being used and can have backlinks for each artifact to allow responders to get more details on what the artifact is and what it entails. The graph view for this example would look a little something like this:
Sharing Notes + Version Control
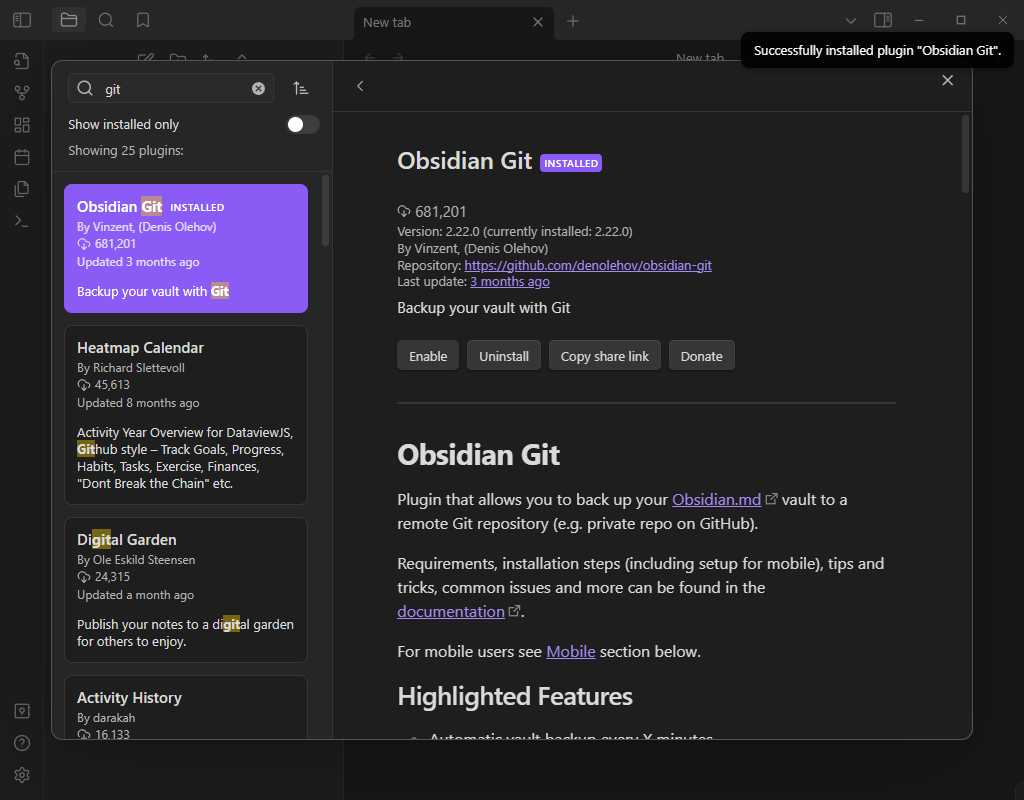
“This all sounds great, but surely our team would have to continue to maintain our internal Confluence page as a centralized storage for notes as it would be difficult to share Obsidian notes between the team.” Well, another incredible feature of Obsidian is its well-maintained and mature collection of community-made plugins—one of which, Obsidian Git, allows for you to store and share your vault using Git. This not only creates a centralized location for teams to access and update the same vault in real time, but also introduces version control and management to the internal note-taking database.
To get started, simply enable Community Plugins in the settings of your vault, browse for the Obsidian Git plugin and follow the installation instructions provided.
By storing your vault in a Git repository, your team can easily access, update, and maintain your notes collectively. Note: plugins are managed individually per vault, meaning you can add additional plug-ins and that change will populate for the entire team!
Closing Thoughts
We think it is fair to say that many incident responders, security analysts, etc. have dealt with the terror of sifting through documentation, runbooks, etc. that had information scattered all over the place. When discussing with friends who have been in incident response, a big pain point has been their runbooks and documentation which contributed a lot of inspiration into making TAC. We hope that this methodology in note taking helps security analyst and incident response teams that are looking to improve how they are creating their documentation / runbooks and adopt TAC and add onto it! If you’d like to streamline the process a bit, we made a template you can use and reference to make implementing TAC easy! You can find a template of TAC on GitHub here. Simply clone the repo and open the folder as a vault in Obsidian and you should be good to go!